In a previous blog post I wrote about collecting server statistics with Collectd, passing them to InfluxDB and graphing them with Grafana. Using “Retention Policies” (RPs) and “Continuous Queries” (CQs) metrics could be downsampled to reduce storage usage.
This blog post shows how to do the same with InfluxDB v2.
InfluxDB v2
At the end of 2020 InfluxDB v2 was released. Moving to InfluxDB v2 with the setup I had (Collectd input, downsampling) came with some challenges:
- Accessing InfluxDB v2 through API tokens
- “Databases” + “Retention Policies” have been replaced by “Buckets”
- “InfluxQL” is replaced by the “Flux” query language
- “Continuous Queries” are replaced by “Tasks” written in the “Flux” query language
- InfluxDB dropped support for the Collectd protocol
InfluxDB Organization, Buckets and API tokens
InfluxDB v2 is secure by default, which means it requires authentication to write or read data. For this use-case it means an API token must be configured with write access to write metrics to a bucket.
The commands below creates organization “my-org”, a bucket and an API token.
# Create org "my-org"
influx org create -n my-org

# Create a bucket
influx bucket create -o my-org -n collectd/autogen --retention 3h20m --shard-group-duration 1h

# Create "collectd" user with write access to bucket "collectd/autogen"
BUCKET=$(influx bucket list --hide-headers -n collectd/autogen | awk '{print $1}')
influx auth create --org my-org --description 'collectd' --read-bucket $BUCKET --write-bucket $BUCKET
Hooking up Collectd to InfluxDB v2
InfluxDB dropped support for the Collectd protocol. Instead the documentation refers to Telegraf to sit in between as a proxy and translate the Collectd protocol to the InfluxDB line protocol.
Two pieces of Telegraf configuration are required to push the Collectd metrics to the “collectd/autogen” bucket. One “inputs” configuration to listen on the collectd port. And another “outputs” configuration to pass the metrics to InfluxDB.
$ cat /etc/telegraf/telegraf.d/inputs-collectd.conf
[[inputs.socket_listener]]
  service_address = "udp://:25826"
  data_format = "collectd"
  collectd_typesdb = ["/usr/share/collectd/types.db"]
  collectd_parse_multivalue = "split"

  [inputs.socket_listener.tags]
    bucket = "collectd"
$ cat /etc/telegraf/telegraf.d/outputs-influxdb2.conf
[[outputs.influxdb_v2]]
  urls = ["http://<InfluxdDB-IP-address>:8086"]
  token = "<InfluxDB-Token-For-Collectd-User>"
  organization = "my-org"
  bucket = "collectd/autogen"

  [outputs.influxdb_v2.tagpass]
    bucket = ["collectd"]
By default Telegraf spits all data to all outputs. Tagging allows you to
control this. The input is tagged with bucket = "collectd". In the
outputs configuration a “tagpass” with the same tag is configured, to only push
metrics with this tag to this output.
When Telegraf is running, Collectd clients can be configured to send their metrics to Telegraf:
LoadPlugin network
<Plugin network>
  Server "<Telegraf-IP-address>" "25826"
</Plugin>
Downsampling data in InfluxDB v2
Telegraf puts the metrics in the “collectd/autogen” bucket. 4 additional buckets can be created to store downsampled data. 4 Flux Tasks are required to periodically downsample the data from one bucket into another. Overall it looks like this:
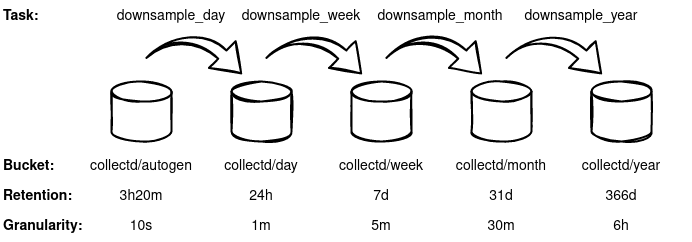
Create the additional buckets:
influx bucket create -o my-org -n collectd/day --retention 1d --shard-group-duration 1h
influx bucket create -o my-org -n collectd/week --retention 7d --shard-group-duration 1d
influx bucket create -o my-org -n collectd/month --retention 31d --shard-group-duration 1d
influx bucket create -o my-org -n collectd/year --retention 366d --shard-group-duration 7d
Create the Flux Tasks:
cat <<EOT > collectd_downsample_day
option task = {name: "collectd_downsample_day", every: 1m}

from(bucket: "collectd/autogen")
    |> range(start: -task.every)
    |> filter(fn: (r) => r._field == "value")
    |> aggregateWindow(every: 1m, fn: mean)
    |> to(org: "my-org", bucket: "collectd/day")
EOT
influx task create -org my-org -f collectd_downsample_day

cat <<EOT > collectd_downsample_week
option task = {name: "collectd_downsample_week", every: 5m}

from(bucket: "collectd/autogen")
    |> range(start: -task.every)
    |> filter(fn: (r) => r._field == "value")
    |> aggregateWindow(every: 5m, fn: mean)
    |> to(org: "my-org", bucket: "collectd/week")
EOT
influx task create -org my-org -f collectd_downsample_week

cat <<EOT > collectd_downsample_month
option task = {name: "collectd_downsample_month", every: 30m}

from(bucket: "collectd/day")
    |> range(start: -task.every)
    |> filter(fn: (r) => r._field == "value")
    |> aggregateWindow(every: 30m, fn: mean)
    |> to(org: "my-org", bucket: "collectd/month")
EOT
influx task create -org my-org -f collectd_downsample_month

cat <<EOT > collectd_downsample_year
option task = {name: "collectd_downsample_year", every: 6h}

from(bucket: "collectd/day")
    |> range(start: -task.every)
    |> filter(fn: (r) => r._field == "value")
    |> aggregateWindow(every: 6h, fn: mean)
    |> to(org: "my-org", bucket: "collectd/year")
EOT
influx task create -org my-org -f collectd_downsample_year
Auto-selecting the correct bucket
In the previous blogpost I described a trick how to let Grafana automatically select the correct bucket (previously called Retention Policy) based on the selected time-range.
The same thing can be done in InfluxDB v2:
influx bucket create -o my-org -n collectd/forever --retention 0

influx write -o my-org --bucket collectd/forever '
rp_config,idx=1 rp="autogen",start=0i,end=12000000i,interval="10s" -9223372036854775806
rp_config,idx=2 rp="day",start=12000000i,end=86401000i,interval="60s" -9223372036854775806
rp_config,idx=3 rp="week",start=86401000i,end=604801000i,interval="300s" -9223372036854775806
rp_config,idx=4 rp="month",start=604801000i,end=2678401000i,interval="1800s" -9223372036854775806
rp_config,idx=5 rp="year",start=2678401000i,end=31622401000i,interval="21600s" -9223372036854775806
'
The $rp variable can be created as described in the previous blog post to allow automatic selection of the correct bucket.
Grafana Dashboard
I’m still using the same Grafana Dashboard: https://grafana.com/dashboards/10179
A separate grafana user is required with read access to the required buckets.
# Create "grafana" user with read access for the "collectd/*" buckets
BUCKET_AUTOGEN=$(influx bucket list --hide-headers -n collectd/autogen | awk '{print $1}')
BUCKET_DAY=$(influx bucket list --hide-headers -n collectd/day | awk '{print $1}')
BUCKET_WEEK=$(influx bucket list --hide-headers -n collectd/week | awk '{print $1}')
BUCKET_MONTH=$(influx bucket list --hide-headers -n collectd/month | awk '{print $1}')
BUCKET_YEAR=$(influx bucket list --hide-headers -n collectd/year | awk '{print $1}')
BUCKET_FOREVER=$(influx bucket list --hide-headers -n collectd/forever | awk '{print $1}')
influx auth create --org my-org --description 'grafana' --read-bucket $BUCKET_AUTOGEN --read-bucket $BUCKET_DAY --read-bucket $BUCKET_WEEK --read-bucket $BUCKET_MONTH --read-bucket $BUCKET_YEAR --read-bucket $BUCKET_FOREVER
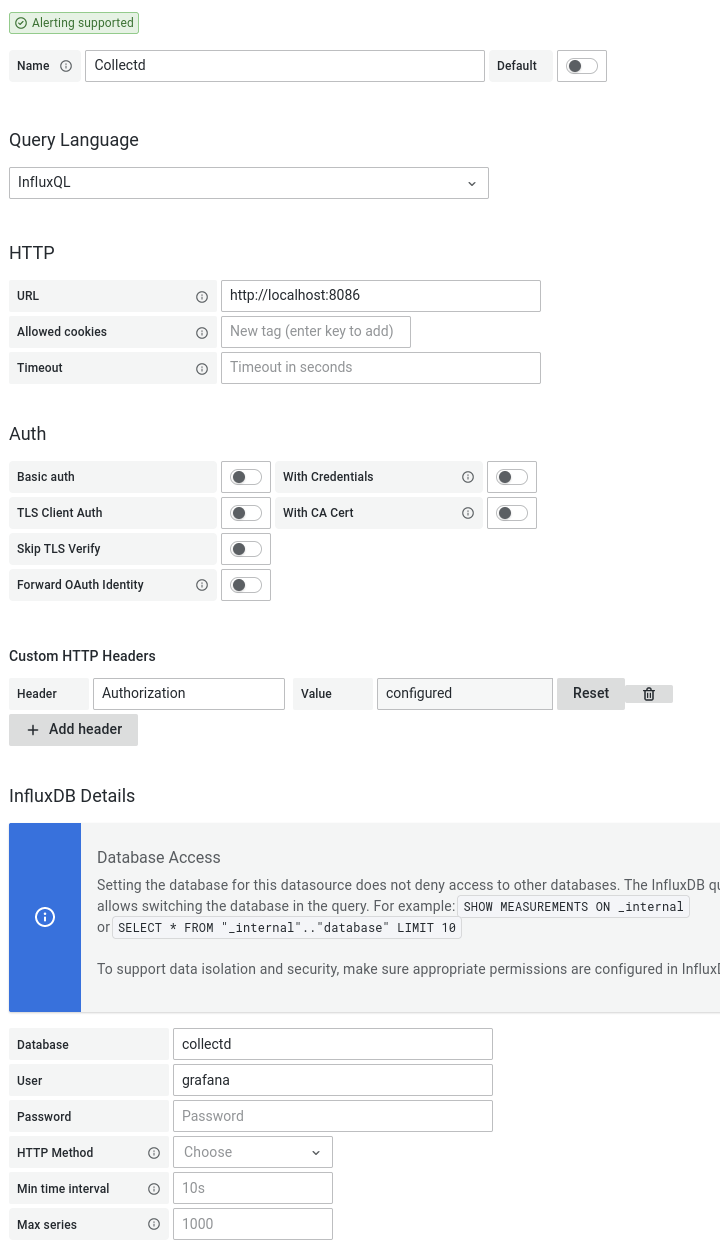
The dashboard still uses InfluxQL to query the data in InfluxDB v2. Configure
the datasource in Grafana as shown in the image below. Configure a “Custom HTTP
Header” for Authorization with value Token <InfluxDB-Token-For-Grafana-User>