It’s a little over a year ago that I got solar panels installed on my roof. Not a Tesla Solar Roof, but the most efficient solar panels available last year. From SunPower. The SPR-X21-350-BLK. Together with a SolarEdge SE5K converter its producing 5300 Watt during peak hours.
I’m interested if a Tesla Powerwall is worth it financially. Will it pay back the investment in a reasonable amount of time?
In the Netherlands there is still a net metering policy until 2023, which means that you can administratively subtract the electricity you have delivered to, from what you have used from the electricity network. Basically you can use the electricity network as a big battery to store solar overproduction.
Starting in 2023 the net metering policy will be phased out gradually. Based on the current pricing you pay around €0.25 per kWh, but for delivering you only get between €0.04 and €0.12 per kWh depending on the contract with your supplier. It becomes financially more attractive to use as much electricity as possible from your solar panels directly or via a battery.
Preparing for the year 2023 I have some research questions after one year of having solar panels:
- How much electricity is actually used directly from my solar panels?
- Is it worth investing in a Tesla Powerwall to use more of my own solar power?
Collecting the data
Since the start I’ve been collecting metrics from the Solaredge inverter using a wrapper script around sunspec-monitor. The main metric I’m collecting from the inverter is the “energy_total” metric, which is the total amount of Watt hours produced by the inverter. This metric is collected every 60 seconds and stored in InfluxDB.
Using a USB cable connected to the P1 port of my electricity meter I’m also collecting metrics about the amount of electricity consumed from and delivered to the electricity network every 60 seconds.
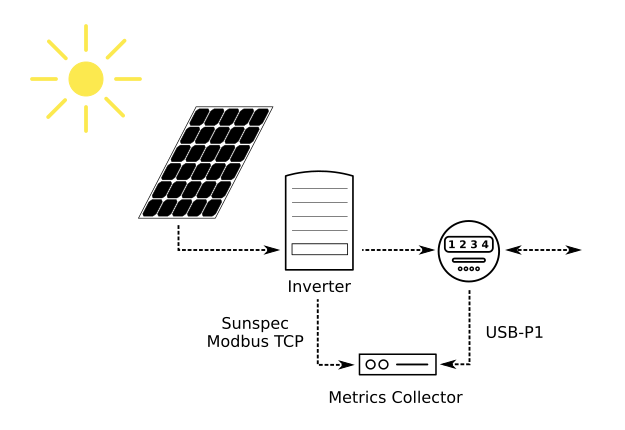 Overview of metrics collection from Inverter and Electricity Meter
In InfluxDB the stored metrics look like this:
> select net_used, delivered, produced from "electricity" order by time desc limit 10;
name: electricity
time                 net_used delivered produced
----                 -------- --------- --------
2020-05-07T07:32:00Z 3207201  5214424   6368160
2020-05-07T07:31:00Z 3207201  5214367   6368100
2020-05-07T07:30:00Z 3207201  5214310   6368039
2020-05-07T07:29:00Z 3207201  5214253   6367978
2020-05-07T07:28:00Z 3207201  5214196   6367918
2020-05-07T07:27:00Z 3207201  5214140   6367858
2020-05-07T07:26:00Z 3207201  5214084   6367798
2020-05-07T07:25:00Z 3207201  5214028   6367739
2020-05-07T07:24:00Z 3207201  5213972   6367679
2020-05-07T07:23:00Z 3207201  5213917   6367620
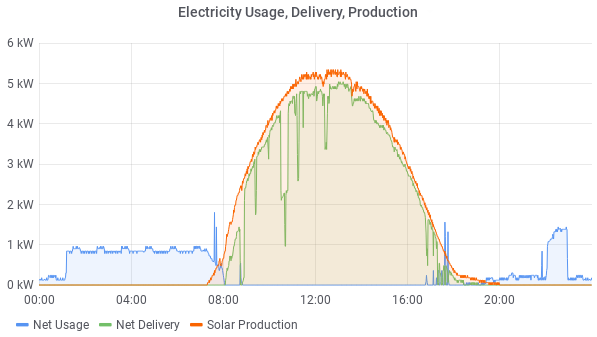
When turning this data into a graph, on a sunny day it look like this:
On a cloudy day it looks like this:
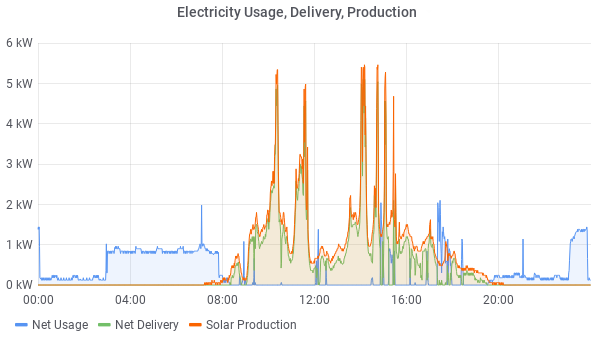
As you can see, I’m not using all the electricity produced by the solar panels directly. Most of it actually is delivered to the electricity network. And during the night, there of course is no sun, so I’m using from the electricity network.
Statistics from Year 1
Looking at some day graphs is nice, but what does this mean overall in a year?
- How much electricity did the solar panels produce?
- How much electricity was delivered to/used from the network?
- How much electricity was consumed from the solar panels directly?
- How much electricity did I consume in total?
The answers to the 1st two questions is pretty easy to find. Take the number from the 3 columns in InfluxDB from today and subtract the values from 1 year ago.
The answer to question 3 can be answered by subtracting “delivery” from “production”. Its also possible to have per minute statistics for direct consumption by creating a “Continuous Query” in InfluxDB:
CREATE CONTINUOUS QUERY cq_consumed ON energy
BEGIN
SELECT mean(produced) - mean(delivered) AS consumed
INTO energy.autogen.electricity
FROM energy.autogen.electricity
GROUP BY time(1m), *
END
The Continuous Query will only generate new “consumed” values. To generate previous values, execute the part between BEGIN and END once.
For the answer to question 4, we need to sum “consumed” (generated by the previous Continuous Query) and “net_used”:
CREATE CONTINUOUS QUERY cq_total_used ON energy
BEGIN
SELECT mean(consumed) + mean(net_used) AS total_used
INTO energy.autogen.electricity
FROM energy.autogen.electricity
GROUP BY time(1m), *
END
In InfluxDB it now looks like this (first and last metric of year 1):
> select net_used, delivered, produced, consumed, total_used from "electricity" where time < '2019-04-21' order by time desc limit 1;
name: electricity
time                 net_used delivered produced consumed total_used
----                 -------- --------- -------- -------- ----------
2019-04-20T23:59:00Z 337620   1224      373      -851     336769

> select net_used, delivered, produced, consumed, total_used from "electricity" where time < '2020-04-21' order by time desc limit 1;
name: electricity
time                 net_used delivered produced consumed total_used
----                 -------- --------- -------- -------- ----------
2020-04-20T23:59:00Z 3117433  4841893   5919356  1077463  4194896
Putting the results in a Grafana dashboard gives an interesting overview of year 1:
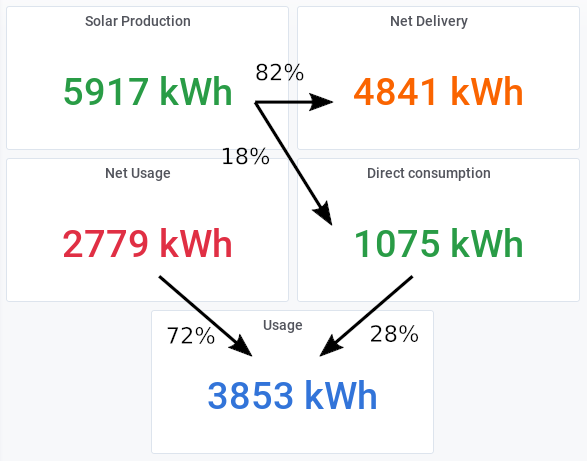 Overview of electricity production, usage and delivery (ignore the rounding errors)
The answers to my questions:
- How much electricity did the solar panels produce?
- 5917kWh produced
- How much electricity was delivered to/used from the network?
- 4841kWh delivered to the network
- 2779kWh used from the network
- How much electricity was consumed from the solar panels directly?
- 1075kWh consumed directly
- How much electricity did I consume in total?
- 3853kWh used in total
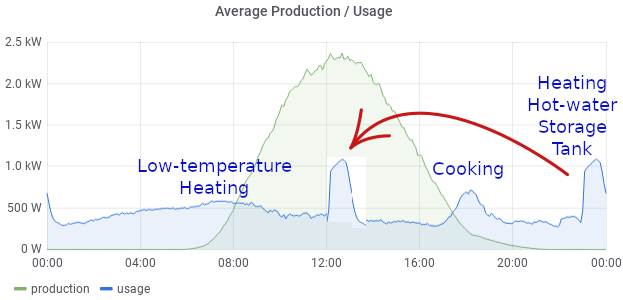
The solar panels produced 54% more then I consumed in total, but still I need to get 72% of my electricity from the electricity network. The average daily production/usage graph below shows why. Most of the electricity is consumed when the sun is not shining. 😕
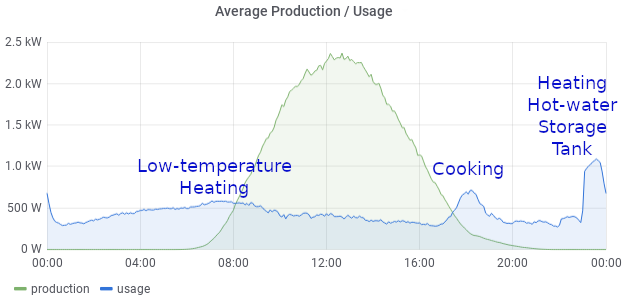 Daily average electricity production / usage
What does this mean in terms of yearly costs/profit, taking €0.25 per kWh for usage and €0.11 per kWh for delivery. Without having solar panels my cost would have been (3853 x 0.25) = €963.25
- With net metering: (4841-2779) x 0.11 = €226.82 profit
- Without net metering: 694.75 – 532.51 = €162.24 costs
- 2779 x 0.25 = €694.75 costs
- 4841 x 0.11 = €532.51 profit
What if I only would get €0.04 per kWh for delivery?
- With net metering: (4841-2779) x 0.04 = €82.48 profit
- Without net metering: 694.75 – 193.64 = €501.11 costs
- 2779 x 0.25 = €694.75 costs
- 4841 x 0.04 = €193.64 profit
Conclusions from Year 1
- Only 18% of the solar energy is directly consumed
- About 54% more electricity is produced then actually needed
- Still 72% of the electricity comes from the electricity network, because there is no(t enough) solar energy available when needed
- Currently there is a annual profit of €227.04
- Without net metering that would been €162.24 profit
- Future worse case (€0.04 without net metering after 2023): €501.11 costs 🙁
Simulating the Tesla Powerwall
The Tesla Powerwall. There are many interesting things to write about it, but let’s keep it simple and focused. Some specs:
- 14kWh of electricity can be stored
- 13.5kWh of this is usable (completely discharging would be bad for the battery)
- Of the electricity you put in, 90% you will get out of it (Round Trip Efficiency)
- Current price: € 8240
With all the data in InfluxDB and the specs above, it is possible to simulate a Powerwall minute by minute. I’ve written some python code that does this. In the simulation the battery has a minimum threshold of 500 Wh, a maximum of 14000 Wh and it takes the Round Trip Efficiency of 90% into account by dividing by 0.9 when electricity is used from the battery.
#!/usr/bin/env python3
from influxdb import InfluxDBClient

influx_client = InfluxDBClient('localhost', 8086, 'username', 'password', 'database')


def influx(measurements):
  try:
    influx_client.write_points(measurements)
  except Exception as e:
    print('Failed to write to influxdb: ', e)


def charge(battery, delivered, net_used):
    if net_used > 0:
        if battery['level'] - (net_used / battery['efficiency']) < battery['min']:
            remaining_battery = battery['level'] - battery['min']
            battery['level'] = battery['min']
            battery['net_usage'] = battery['net_usage'] + (net_used - (remaining_battery * battery['efficiency']))
        else:
            battery['level'] = battery['level'] - (net_used / battery['efficiency'])

    if delivered > 0:
        if battery['level'] + delivered > battery['max']:
            remaining_battery = battery['max'] - battery['level']
            battery['level'] = battery['max']
            battery['net_delivery'] = battery['net_delivery'] + (delivered - remaining_battery)
        else:
            battery['level'] = battery['level'] + delivered

    return battery


def main():
    prev_point = None
    measurements = []
    starttime = '2019-01-01'
    battery = {
        "level": 0,
        "net_usage": 0,
        "net_delivery": 0,
        "min": 500,
        "max": 14000,
        "efficiency": 0.9,
    }

    result = influx_client.query("""select delivered, net_used from "autogen"."electricity" where time >= '{}' order by time;""".format(starttime))

    points = result.get_points()
    for point in points:
        if prev_point is not None:
            for key in ['delivered', 'net_used']:
                if point[key] is None:
                    point[key] = prev_point[key]
            delivered = int(point['delivered']) - int(prev_point['delivered'])
            net_used = int(point['net_used']) - int(prev_point['net_used'])
            battery = charge(battery, delivered, net_used)
            measurements.append({
              "measurement": "battery",
              "time": point['time'],
              "fields": {
                  "powerwall_level": int(battery['level']),
                  "powerwall_net_usage": int(battery['net_usage']),
                  "powerwall_net_delivery": int(battery['net_delivery']),
              },
            })
        prev_point = point
        if len(measurements) > 1000:
            influx(measurements)
            print(".")
            measurements = []
    influx(measurements)


if __name__ == "__main__":
    main()
A part of the result is shown below in a graph with the simulation of 3 days. To compare, I’ve also created a graph without the Tesla Powerwall simulation.
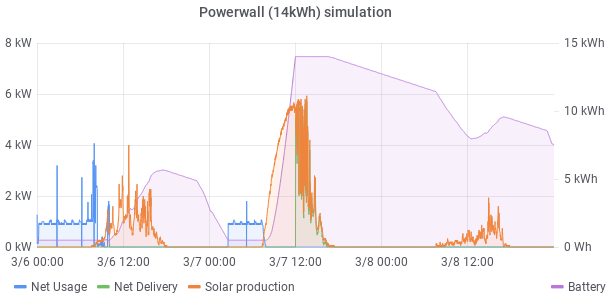 Tesla Powerwall Simulation: 3 days of electricity usage, delivery and Tesla Powerwall electricity level
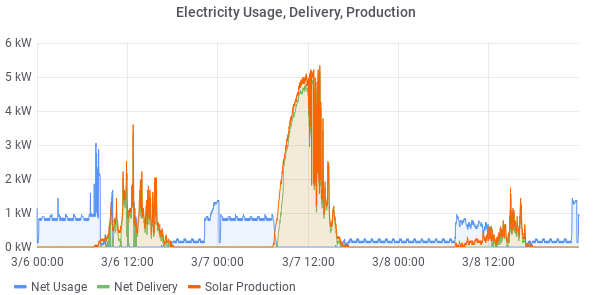 3 day electricity usage, delivery and production without a Tesla Powerwall
With a Tesla Powerwall less electricity is used from the network (Net Usage (blue)). During a sunny day (day 2) the Powerwall is completely charged. The day after electricity is still being used from the Powerwall that was produced the day before. That is pretty cool! 🙂
What would this have meant when I would have had a Powerwall in the past year? These statistics can be collected the same way the “Statistics for Year 1” were collected.
> select * from "battery" where time < '2019-04-22' order by time asc limit 1;
name: battery
time                 powerwall_level powerwall_net_delivery powerwall_net_usage
----                 --------------- ---------------------- -------------------
2019-04-21T00:01:00Z 500             0                      453

> select * from "battery" where time < '2020-04-21' order by time desc limit 1;
name: battery
time                 powerwall_level powerwall_net_delivery powerwall_net_usage
----                 --------------- ---------------------- -------------------
2020-04-20T23:59:00Z 10216           2876167                1020952
Querying InfluxDB for this data shows that with a Powerwall, 2877kWh would have been delivered to the electricity network and 1021kWh would have still been used from the network. This Grafana dashboard gives a clear overview:
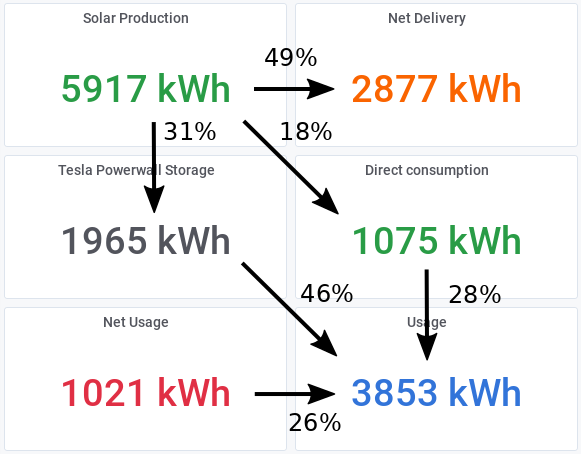
Without a Powerwall I needed to get 72% of my electricity from the network. This is now reduced to 26%. 31% of the solar production gets stored in the Powerwall for later use.
Why do I still need to get 26% of the electricity from the network?
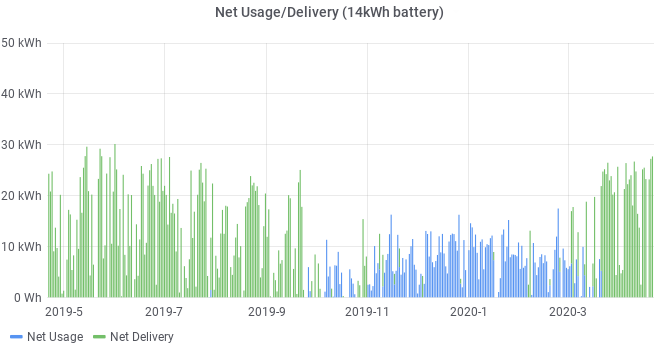 Daily Electricity Network Usage / Delivery when simulating a Tesla Powerwall
The graph above shows why. In the winter there is just not enough solar production to cover my needs. The graph below shows the same data, but without a Powerwall.
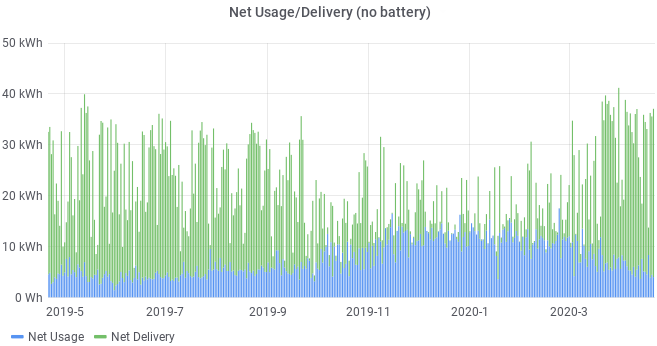 Daily Electricity Network Usage / Delivery (without a Tesla Powerwall)
Back to the simulation. What does it mean in terms of costs/profit, again taking €0.25 per kWh for usage and €0.11 per kWh for delivery.
- With net metering: (2877-1021) x 0.11 = €204.16 profit
- Without net metering: 316.47 – 255.25 = €61.22 profit
- 1021 x 0.25 = €255.25 costs
- 2877 x 0.11 = €316.47 profit
Or what if I only would get €0.04 per kWh for delivery?
- With net metering: (2877-1021) x 0.04 = €82.48 profit
- Without net metering: 115.08 – 255.25 = €140.17 costs
- 1021 x 0.25 = €255.25 costs
- 2877 x 0.04 = €115.08 profit
Conclusions from Simulating a Tesla Powerwall
- I would make €204.16 profit instead of €226.82 currently, with net metering. This is actually a decrease in profit because energy gets lost because of the round trip efficiency of the Powerwall.
- Worst case in the example scenario described above (€0.04 per kWh for delivery), without net metering I would have €140.17 energy costs with a Powerwall and €501.11 costs without. Here it starts to work out.
- With a yearly cost saving of €360.94 (501.11-140.17) it would take around 23 years to make a Tesla Powerwall profitable in my current situation.
So is it worth investing in a Tesla Powerwall to use more of my own solar power?
It depends on your investment horizon. But for me it’s a “No”. 23 years is a bit too much. Taking into account that the Tesla Powerwall 2 only has a warranty period of 10 years. Besides that the battery quality will get worse over time and the storage capacity of the Powerwall will decrease.
Other considerations
Timing of Heating Hot-water Storage Tank
You have to get it while its hot, right? Definitely with solar. To prepare for the year 2023, you should use as much electricity from your solar panels directly as possible. Also if you have a Tesla Powerwall.
I’m not going to cook earlier during the day. And the low-temperature heating mostly happens in the winter during the night to keep the in-house temperature stable, which is supposed to be efficient already. But what could be done is heating the hot-water storage tank during the day, when there is solar power available. This should decrease the amount of electricity delivered to and used from the electricity network.
LG Chem RESU
You don’t have to buy a Telsa Powerwall. There are many alternatives, like a battery from the LG Chem RESU series. I’ve done the same calculations as with the Powerwall, without net metering, €0.04 per kWh for delivery. With a Return on Investment of 12 to 14 years, this seems to be more interesting then the Powerwall.
| Net delivery | Net Usage | Stored kwh | Investment | Savings / Year | ROI | |
|---|---|---|---|---|---|---|
| No battery | 4841 (82%) | 2779 (72%) | 0 (0%) | € 0 | € 0 | – |
| Powerwall | 2877 (49%) | 1021 (26%) | 1965 (33%) | € 8240 | € 360.94 | 22.8 years |
| RESU 13 | 2958 (50%) | 1009 (26%) | 1884 (32%) | € 6853 | € 367.18 | 18.7 years |
| RESU 10 | 3077 (52%) | 1118 (29%) | 1765 (30%) | € 4961 | € 344.69 | 14.4 years |
| RESU 6.6 | 3302 (56%) | 1327 (34%) | 1540 (26%) | € 3812 | € 301.44 | 12.6 years |
| RESU 3.3 | 3870 (65%) | 1861 (48%) | 972 (16%) | € 2602 | € 190.66 | 13.6 years |