Bonnie++ is the perfect tool to benchmark disk I/O performance. When you want to run heavy disk I/O consuming applications on a server, you need to know what the disk I/O limits are to have an indication what you can run on it. Bonnie gives you information about read-, write-, rewrite Block I/O performance and the performance of file creation and deletion.
Below is a sample piece of Bonnie++ output. It is hard to read, and when you’ve done a couple of runs on different hosts, it’s hard to compare these results.
Version 1.96 ------Sequential Output------ --Sequential Input- --Random- Concurrency 1 -Per Chr- --Block-- -Rewrite- -Per Chr- --Block-- --Seeks-- Machine Size K/sec %CP K/sec %CP K/sec %CP K/sec %CP K/sec %CP /sec %CP host3 16G 1028 0 94051 0 40554 0 1668 0 121874 0 380.3 0 Latency 16101us 7694ms 7790ms 13804us 124ms 76495us Version 1.96 ------Sequential Create------ --------Random Create-------- host3 -Create-- --Read--- -Delete-- -Create-- --Read--- -Delete-- files /sec %CP /sec %CP /sec %CP /sec %CP /sec %CP /sec %CP 256 50115 0 332943 0 2338 0 51591 0 +++++ +++ 1189 0 Latency 312ms 1088us 10380ms 420ms 15us 15792ms 1.96,1.96,host3,1,1329840761,16G,,1028,0,94051,0,40554,0,1668,0,121874,0,380.3,0,256,,,,,50115,0,332943,0,2338,0,51591,0,+++++,+++,1189,0,16101us,7694ms,7790ms,13804us,124ms,76495us,312ms,1088us,10380ms,420ms,15us,15792ms
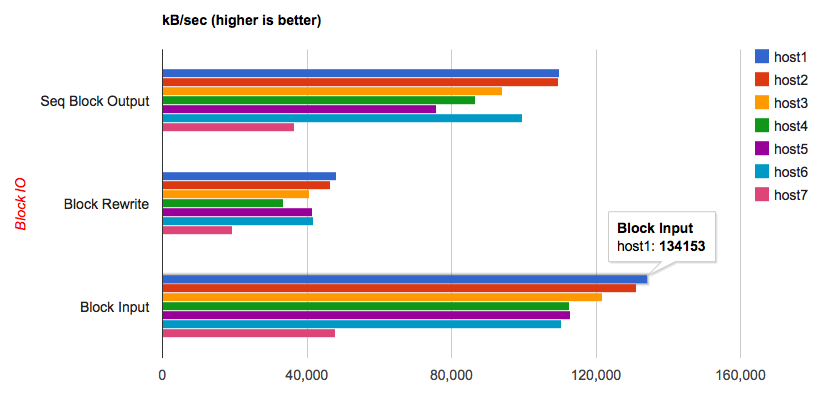
Inspired by bonnie-to-chart I’ve developed a tool called bonnie2gchart. With the CSV data Bonnie provides after a run, you can visualize that information in a graph with bonnie2gchart. bonnie2gchart uses the Google Chart API to create the graphs. It’s compatible with Bonnie++ 1.03 and 1.96. And it is also able to show the results of both versions in one graph.
Demo: http://demo.nethuis.nl/bonnie2gchart/
Download: https://github.com/…/bonnie2gchart.tar.gz
Git: git://github.com/pommi/bonnie2gchart.git
Thanks for this.
It works great for 1.96, but just says “not enough columns” for 1.03.
Can you provide me the full output of your Bonnie++ run with version 1.03?
I get the same as “Thankful Dude”
1.96:
1.96,1.96,vegas-disconnected,1,1345134140,8G,,1037,97,50340,2,31688,2,4805,90,15
96123,76,372.4,5,16,,,,,19687,19,+++++,+++,+++++,+++,+++++,+++,+++++,+++,+++++,+
++,7863us,476ms,925ms,2094us,76843us,241ms,396us,368us,389us,293us,30us,44us
1.03d
vegas-actual,4G,18359,78,20400,13,20154,10,23421,71,32345,6,377.0,1,16,24808,95,
+++++,+++,+++++,+++,+++++,+++,+++++,+++,23022,72
Thanks Jacob, I’ve fixed support for bonnie 1.03.
Php/Html is not a strong suit of mine, and it isn’t clear to me how to get thiis to run. I’ve tried:
prompt> php index.php > results.html
prompt> firefox results.html
This produces what ‘appears’ to be correct, but the resulting links don’t produce anything.
Any hints as to what I’m doing wrong. Many thanks!
for anyone else who doesn’t understand how to use this php file, i’ll make it simple: find out if apache and php are installed and apache is running on your linux distro. assuming they are, copy the contents of the bonnie2gchart tar.gz file to /var/www/bonnie2gchart or something similar. the end result will be that index.php will be in /var/www/bonnie2gchart/index.php. having done this, and having placed your own data in bonnie.csv in /var/www/bonnie2gchart/bonnie.csv, go to 127.0.0.1/bonnie2gchart/index.php apache should then run the code contained in the php file and render the results using google chart in your browser. have fun!
Regarding the instructions for how to get this running properly posted above:
It would probably be useful to put that into the README…. ๐
Your tool does not show any units (ms, us, MB/s) which makes its output pretty useless ๐
Christian: Like in the screenshot above there is “kB/sec”, right!?
Otherwise feel free to fork this project on Github and add support for it ๐
@pommi: Sorry, I must have been blind or something, there are indeed units…. I’m feeling stupid ๐
can someone explain this error ?
I am not very handy with scripts
[Tue Nov 26 11:32:22 2013] [error] [client 127.0.0.1] PHP Fatal error: Call to undefined function array_fill_keys() in /var/www/bonnie2gchart/inc/functions.php on line 38
PHP 5.2 is required. I think that’s the problem, because function array_fill_keys is missing.
Pingback: 18TB Home NAS/HTPC with ZFS on Linux (Part 3) ยป the Void
Thank you for this, very handy!
Hey I so when I run the code like this
php index.php bonnie++
I only get the index file but when I go to click on the charts it nothing appears